Enrolment options
Linked learning / Business / Charts + Graphs
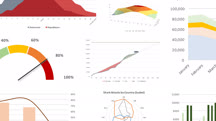
Excel Data Visualization Part 1: Mastering 20+ Charts and Graphs
Learn to use Excel for data visualization. Explore the most useful chart and graph tools, including scatterplots, histograms, sparklines, 3D power maps, and geospatial heat maps.
Guests cannot access this course. Please log in.