 آموزش ضروری D3.js برای دانشمندان داده
(Mitalearn-99481)
آموزش ضروری D3.js برای دانشمندان داده
(Mitalearn-99481)
- Duration: 4 hours 38 minutes
- Release date: 21 June 2026
- Author: Emma Saunders
- Level: متوسط
- Contents: 74
- Has Caption in Persian
درباره این دوره:
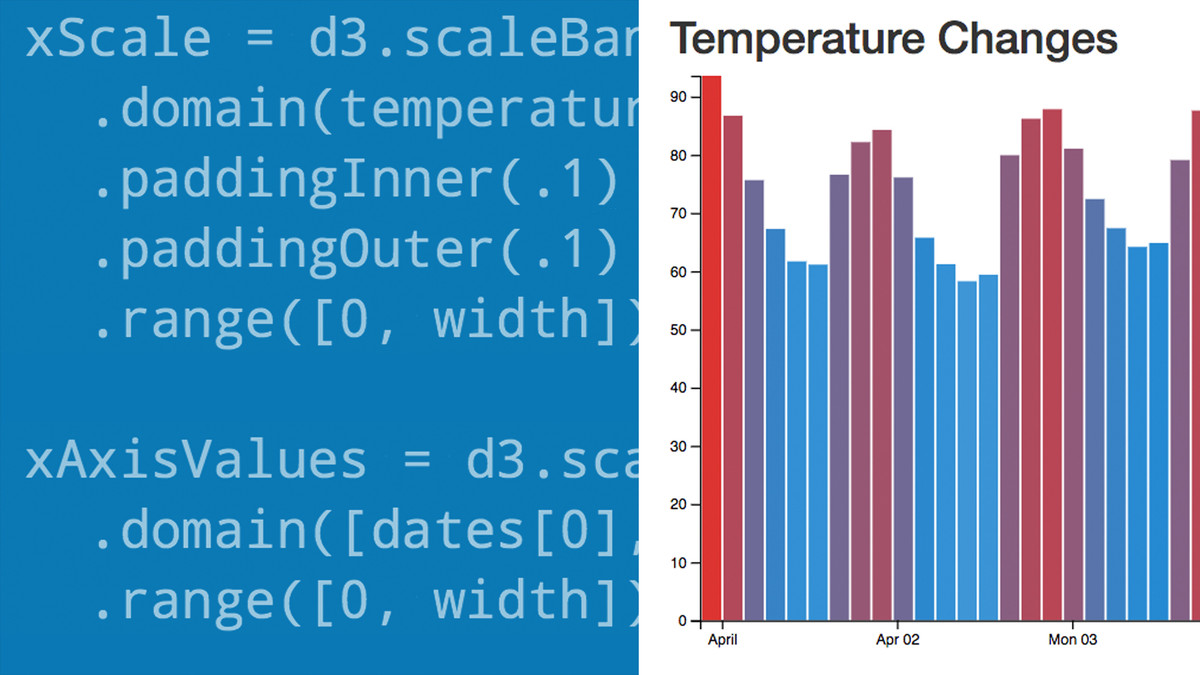
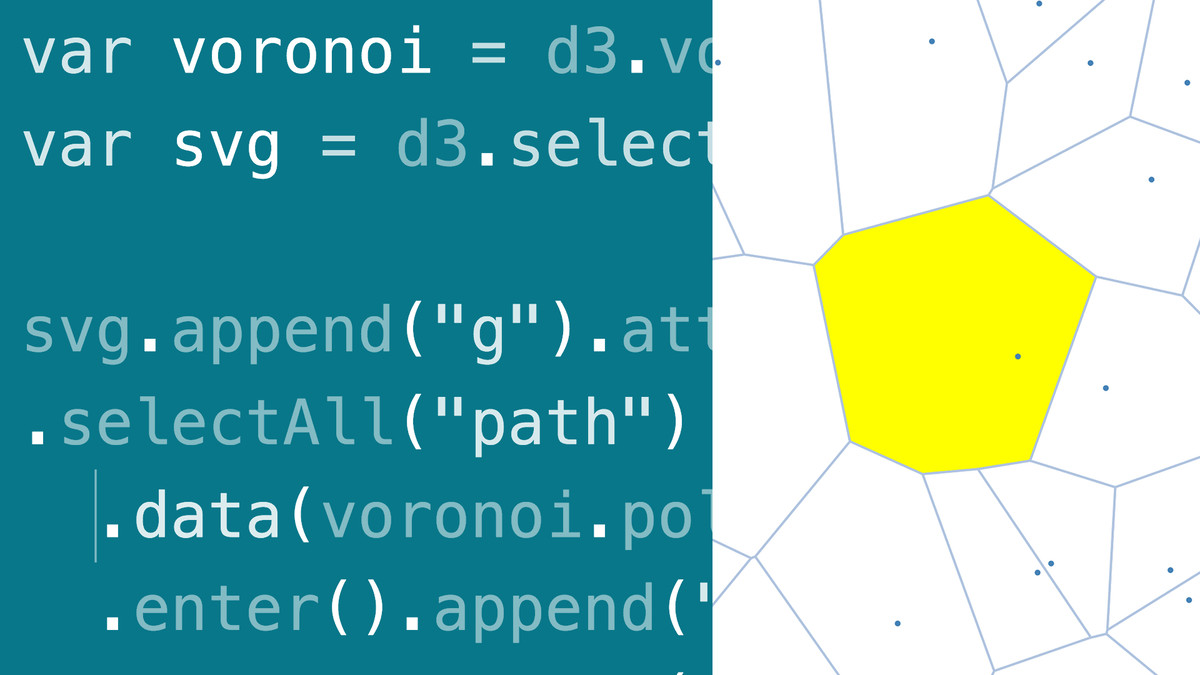
تجسم های خود را فراتر از نمودارهای خسته کننده ببرید. D3.js شما را قادر میسازد تا نقشههای فضایی، نمودارهای درختی، نمودارهای پشتهای و موارد دیگر را با یک مرورگر وب و چند خط کد ایجاد کنید. چیزی برای همه در علم داده وجود دارد: آماردانان، دانشمندان، ریاضیدانان و تحلیلگران. D3.js Essential Training for Data Scientists کلیدهای این رویکرد همه کاره را باز می کند. با مشاور داده اما ساندرز همراه باشید زیرا او نحوه ساخت تصاویر زیبا و تعاملی داده با D3 را نشان می دهد.\r\n\r\n سپس یاد بگیرید که چگونه یک نمودار میله ای ساده بسازید و شکل ها و متن های اصلی را ایجاد کنید. Emma همچنین تابع مسیر و قدرت ژنراتورها را برای ترسیم اشکال پیچیده تر معرفی می کند. سپس بیاموزید که چگونه فایلهای JSON، XML و CSV را برای ایجاد گرافیکهای پیچیدهتر مانند نمودارهای درختی و Voronoi وارد کنید و با استفاده از توابع نقشه، پشته و آشیانه، دادههای خود را برای گرافیکهای پیشرفته دستکاری کنید. این دوره با نکاتی برای افزودن تعامل و انتخاب گرافیک مناسب برای داده های شما به پایان می رسد.
Related Skills
Content
D3.js Essential Training for Data Scientists