Course catalog
Categories
Showing 21-36 of 36 items.
Excel Power User Challenge
Take your Excel skills to the next level with these advanced challenges from an Excel MVP.
Excel: Avoiding Common Mistakes (Office 365/Excel 2019)
Prevent common errors from occurring in your Excel data with this short course.
Excel: Creating a Dashboard with Power Query (Office 365/Microsoft 365)
Learn how to create data-rich Excel dashboards using Power Query.
Excel: Power Pivot for Beginners
Get a short, beginner-friendly introduction to the robust Power Pivot feature in Microsoft Excel for Windows.
Excel: Power Query (Get & Transform)
Learn about the time-saving capabilities of Power Query (Get & Transform) for easily importing, connecting, combining, and refining data in Excel with reusable queries.
Excel: Productivity Tips
Add powerful productivity tools to your Excel skill set. Learn shortcuts and hidden tools for supercharging your efficiency in Microsoft Excel.
Excel: Using Dynamic Array Functions (Office 365/Microsoft 365)
Learn how to use the seven new dynamic array functions in Microsoft Excel.
Excel: Working Together with Power Query and Power Pivot
Learn how to combine Power Query and Power Pivot, two robust features of Microsoft Excel, to analyze data.
Google Sheets: Advanced Formulas and Functions
Learn how to summarize, analyze, and calculate data using the advanced formulas and functions available in Google Sheets.
Google Sheets: Pivot Tables
Learn how to summarize and rearrange your Google Sheets data dynamically with pivot tables.
Introduction to Data Science
Get an introduction to the exciting world of data science. Learn about the workflow, tools, and techniques you need to advance your skills and pursue new career opportunities.
Learning Excel What-If Analysis
Analyze hypothetical business cases using Excel formulas and variable data.
Microsoft Power Apps: AI Builder
Learn how to use the AI Builder in Microsoft Power Apps to add AI capabilities to your apps and key processes—no programming experience required.
Python for Data Visualization
Build accurate, engaging, and easy-to-generate data visualizations using the popular programming language Python.
Using Python with Excel
Take your Excel skills further by using Python. Discover how to inspect, filter, clean, convert, and visualize data with Excel and Python libraries like pandas and openpyxl.
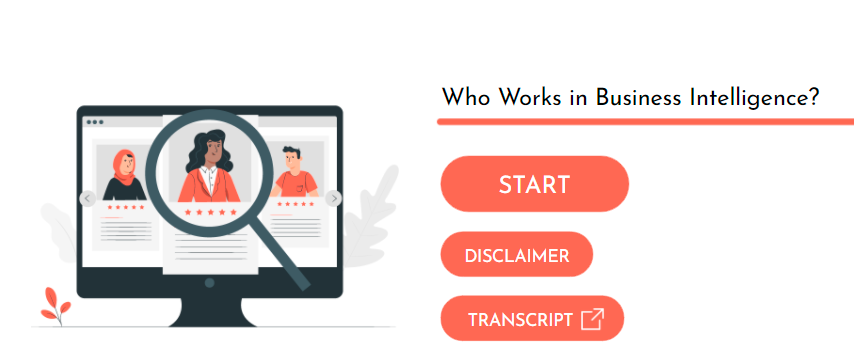
Who Works in Business Intelligence
Business Intelligence (or BI) uses data to help organizations make better decisions.
BI is used in nearly every industry. In many organizations, it’s used by employees at every level and in every department. Even people who don’t work directly with BI tools might be collecting data or receiving data-based reports.
That said, there are two places in any organization where business intelligence is crucial. First, we’ll talk about managers and leaders, who use BI to make informed decisions. Then, we’ll discuss the business intelligence analysts responsible for collecting, analyzing and reporting on data.


