Course catalog
Categories
Showing 2,401-2,420 of 8,871 items.
Data Science Foundations: Data Mining in R (227253)
Data science continues to grow in sophistication and demand at an exponential rate. Data mining is the area of data science that focuses on finding actionable patterns in large and diverse datasets: clusters of similar customers, trends over time that can only be spotted after disentangling seasonal and random effects, and new methods for predicting important outcomes. Instructor Barton Poulson focuses on data mining in R, presents a broad range of algorithms including machine learning methods, and offers important information on laws and policies that affect data mining. Barton gives an overview of dimensionality reduction. He introduces clustering, including hierarchical clustering, then goes into association analysis. He explains time-series mining and decomposition, then concludes with text mining, sentiment analysis, and sentiment scoring.

Data Science Foundations: Fundamentals
Get a basic introduction to the careers, tools, and techniques of modern data science.

Data Science Foundations: Knowledge Graphs (219416)
The term “knowledge graph” describes a semantic search based on the systematic compilation and processing of data and was first coined by Google. Leading internet companies have been using knowledge graphs for several years to present information that is tailored to customers’ needs. You can also use knowledge graphs to map your company’s internal knowledge and improve search results. Knowledge graphs can also improve the results of AI or machine learning systems. In this course, blockchain technology leader Daniel Burgwinkel explains what knowledge graphs are, offers examples and use cases, gives you practical recommendations on how to implement knowledge graphs, and shows you how to build a knowledge base. This course is aimed at data stewards, digital transformation managers, and data scientists who are responsible for data stocks and knowledge management.
Data Science Foundations: Python Scientific Stack
Learn how to use the Python scientific stack to complete data science tasks. Find out how to work with pandas for data crunching, NumPy for numeric computation, and more.

Data Science Methodologies: Making Business Sense (209930)
There is an increasing recognition that data science needs to go beyond small-scale experimentation to a large-scale implementation. In this course, Neelam Dwivedi brings software engineering and data mining methodologies to data scientists, then applies these ideas by taking a simple business need through an entire life cycle—hosting a model, consuming it in a web application, and setting up its CI/CD pipeline. Neelam begins by explaining the methodologies used in the course and how they are combined. She shows you where to begin in developing architecture and deploying a model, then explains how larger web applications may consume the model as a service. Neelam covers how to stage your model and the app, as well as how to plan ahead with an overall roadmap. She concludes with thoughts on how to further applications of data science methodologies.
Data Science on Google Cloud Platform: Architecting Solutions
Learn how to architect data science solutions at scale using the capabilities provided by Google Cloud Platform (GCP).

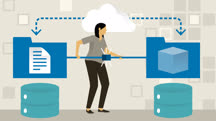
Data Science on Google Cloud Platform: Building Data Pipelines
Learn how to design and build big data pipelines on Google Cloud Platform.
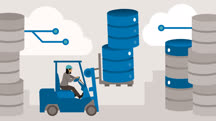
Data Science on Google Cloud Platform: Designing Data Warehouses
Learn how to design and build data warehouses using Google Cloud Platform solutions such as BigQuery.
Data Science on Google Cloud Platform: Exploratory Data Analytics
Learn how to conduct exploratory data analytics on Google Cloud Platform.
Data Science on Google Cloud Platform: Predictive Analytics
Learn how to use Google Cloud Platform to train and deploy machine learning models for predictive analytics.
Data Science Tools of the Trade: First Steps
Jump-start your data science career by learning how to install and work with several essential data science tools, including Proxmox, Hadoop, Spark, and Weka.

Data Steward Foundations (219450)
Data stewardship programs help organizations achieve the maximum value from their information assets. In this course, instructor Mike Chapple shows you the basic foundations of data stewardship and best practices for getting your own data stewardship program off the ground. Mike explores the roles, qualities, and responsibilities of a data steward. He goes over best practices for maintaining data quality, then explains the many protections that go into maintaining data security. Mike discusses privacy controls and the patchwork of international, national, and local laws that govern data security and privacy. He concludes with useful steps you can take in building a data stewardship program.
Data Visualization for Data Analysis and Analytics
Start thinking more clearly and strategically about data visualization. Learn how to leverage best practices in visualization and design to communicate data to any audience.

Data Visualization for Marketers
Showcase your marketing data in engaging ways. Get tips for reducing mental tasks for your audience, highlighting the data that matters most, establishing context, and more.
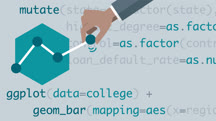
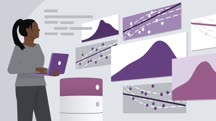
Data Visualization in R with ggplot2
Discover how to create informative and visually appealing data visualizations using ggplot2, the leading visualization package for R.

Data Visualization Tips and Tricks
Do data viz the right way every time. Get data visualization tips to choose the right visualization, chart relationships, visualize data distributions, create maps, and more.
Data Visualization, Storytelling, and Information Design: A Lesson and Listen Series
Learn about key themes in data visualization, data storytelling, and information design, and listen to interviews with leading designers and data visualization experts.

Data Visualization: Best Practices
Build data visualizations that are accurate and compelling. Learn to create charts and graphs that look great and stand up to analysis.
Data Visualization: Storytelling
Learn the keys to telling a story with data from data visualization expert Bill Shander.

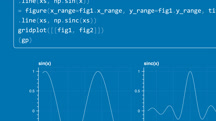
Data Visualizations with Plotly
Learn how to create interactive data visualizations that can be shared online or offline using Plotly.