Course catalog
Categories
Showing 3,381-3,400 of 11,781 items.

Excel Data Analysis: Forecasting
Use Excel's data-analysis tools to create accurate and insightful forecasts.
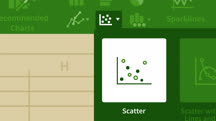
Excel Data Visualization Part 1: Mastering 20+ Charts and Graphs
Learn to use Excel for data visualization. Explore the most useful chart and graph tools, including scatterplots, histograms, sparklines, 3D power maps, and geospatial heat maps.
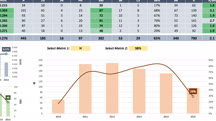
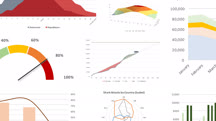
Excel Data Visualization Part 2: Designing Custom Visualizations
Go beyond the built-in chart and graph tools in Excel. Learn how to create custom data visualizations, including how to build dynamic dashboards and gauge charts.

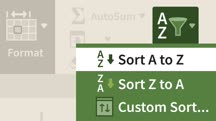
Excel Essential Training (Office 365)
Get up to speed with Microsoft Excel. Learn how to enter and organize data, build charts and PivotTables, sort data, and use other Excel features.
Excel for Accountants
Become a better accountant with the power of Microsoft Excel. Learn how to use it for general ledger entry, forecasting, business valuation, interacting with QuickBooks, and more.
Excel for Business Analysts
This course shows business analysts how to use Excel to measure the health of an organization. Learn how to use Excel to gather, assess, and use business analytics information.

Excel for Corporate Finance Professionals
Discover how to use Excel for essential tasks required in corporate finance. Learn how to pick investments, determine your cost of capital, and perform operational budgeting.

Excel for Investment Professionals
Leverage Excel to make sound investments. Learn how to perform key investment-related activities in Excel, including investment evaluation and analysis on a stock or portfolio.
Excel for Mac 2016 Essential Training
Learn everything you need to master Excel for Mac 2016, including using functions, printing worksheets, and collaborating with others.
Excel for Mac 2016: Advanced Formulas and Functions
Master Excel formulas and functions—once and for all. Get tips for using the most challenging of the 450+ functions in Excel for Mac 2016.

Excel for Mac 2016: Charts in Depth
Learn to create different kinds of Excel charts, from column, bar, and line charts to doughnut and scatter charts, with Excel for Mac 2016.
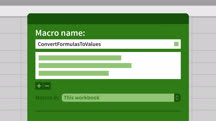
Excel for Mac 2016: Macros
Discover how to create and use macros to automate simple, repetitive tasks in Excel 2016 for Mac.

Excel for Mac Essential Training (Office 365/Microsoft 365)
Master the essential tasks in the Mac version of Excel for Office 365. Learn how to manage workbooks, use core functions and formulas, create charts, and much more.
Excel for Mac Essential Training (Office 365/Microsoft 365) (233713)
- 3 hours 53 mins
Excel for Mac is a powerful tool, but it can be intimidating for new users who either don't know where to start or don't know how to proceed beyond the most basic tasks. In this course, learn how to master the essential tasks in the Mac version of Excel for Office 365. Excel expert Curt Frye shows how to manage workbooks, work with cells and cell data, and sort, filter, and manage worksheets. Plus, learn how to summarize data using core functions and formulas; format worksheet elements; create bar, column, and line charts; create and filter PivotTables; and share your spreadsheets with others.
Excel for Mac: Advanced Formulas and Functions (365/2019) (225349)
- 2 hours 18 mins
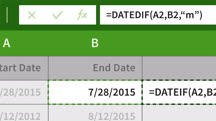
Looking to master all the formulas and functions available in Excel for Mac? In this comprehensive course, Dennis Taylor presents numerous Excel formulas and functions and shows how to use them efficiently. Dennis begins with tips and keyboard shortcuts to accelerate the way you work with formulas within one or multiple worksheets. He then covers how to perform logical tests with the IF, AND, OR, and NOT functions, search and retrieve data with lookup functions (VLOOKUP, XLOOKUP, MATCH, and INDEX), analyze data with statistical functions, use text functions to clean up worksheets, work with array formulas and functions, and master date and time calculations. If you’re looking to up your formulas and functions skills in Excel, join Dennis as he uses practical examples that transition effortlessly to real-world scenarios.
Excel for Mac: PivotTables in Depth
Learn how to summarize and analyze data using one of the most powerful and overlooked features in Excel for Mac: PivotTables.
Excel for Marketers
Learn the most important and powerful features of Excel for marketing. Put formulas, PivotTables, charts, and macros to work for your campaigns.

Excel for Sales Professionals
Learn essential features, best practices, and strategies to track, analyze, and forecast sales.

Excel for the Web Tips and Tricks (Office 365/Microsoft 365) (209556)
- 1 hour
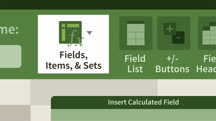
Excel for the web offers many powerful features, but because its interface differs from the interface of the desktop tool, most users only use its basic spreadsheet functionality. In this course, instructor Joshua Rischin shows you how to get more out of Excel for the web. Joshua explains some basics of data, including how to cleanse data and use Flash Fill to add data quickly. He gives several useful tips for using custom formatting, hyperlinks, and conditional formatting in Excel for the web. Joshua goes over how to customize your workbooks, as well as create Pivot Tables and Pivot Charts. He covers ways to collaborate, while still protecting your work, and discusses how to use Excel Desktop to get even more from your Excel for the web experience. He steps you through some advanced features, like Excel Ideas and scripts, then concludes with advice on how to apply what you’ve learned from the course.

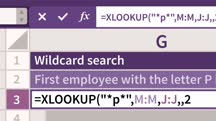
Excel Formulas and Functions Quick Tips
Want to get more out of Excel? Get bite-sized tips designed to help you master some of the program's most useful functions and formulas.